Azure
Azure Honeypot
Honeypot
Company: Network Security Home Lab
 2. Configured the environment to attract global attackers and capture their activities.
 One thing to note is that during the project, I hit the daily API request limit of 1,000 requests provided by ipgeolocation.io. As a result, the IP address from Iran couldn't be converted to geographic data.
Project URL: https://github.com/ericktafel1/AzureHoneypot/blob/main/Honeypot.md
Azure Honeypot with Log Analytics Workspace and Sentinel SIEM
Introduction
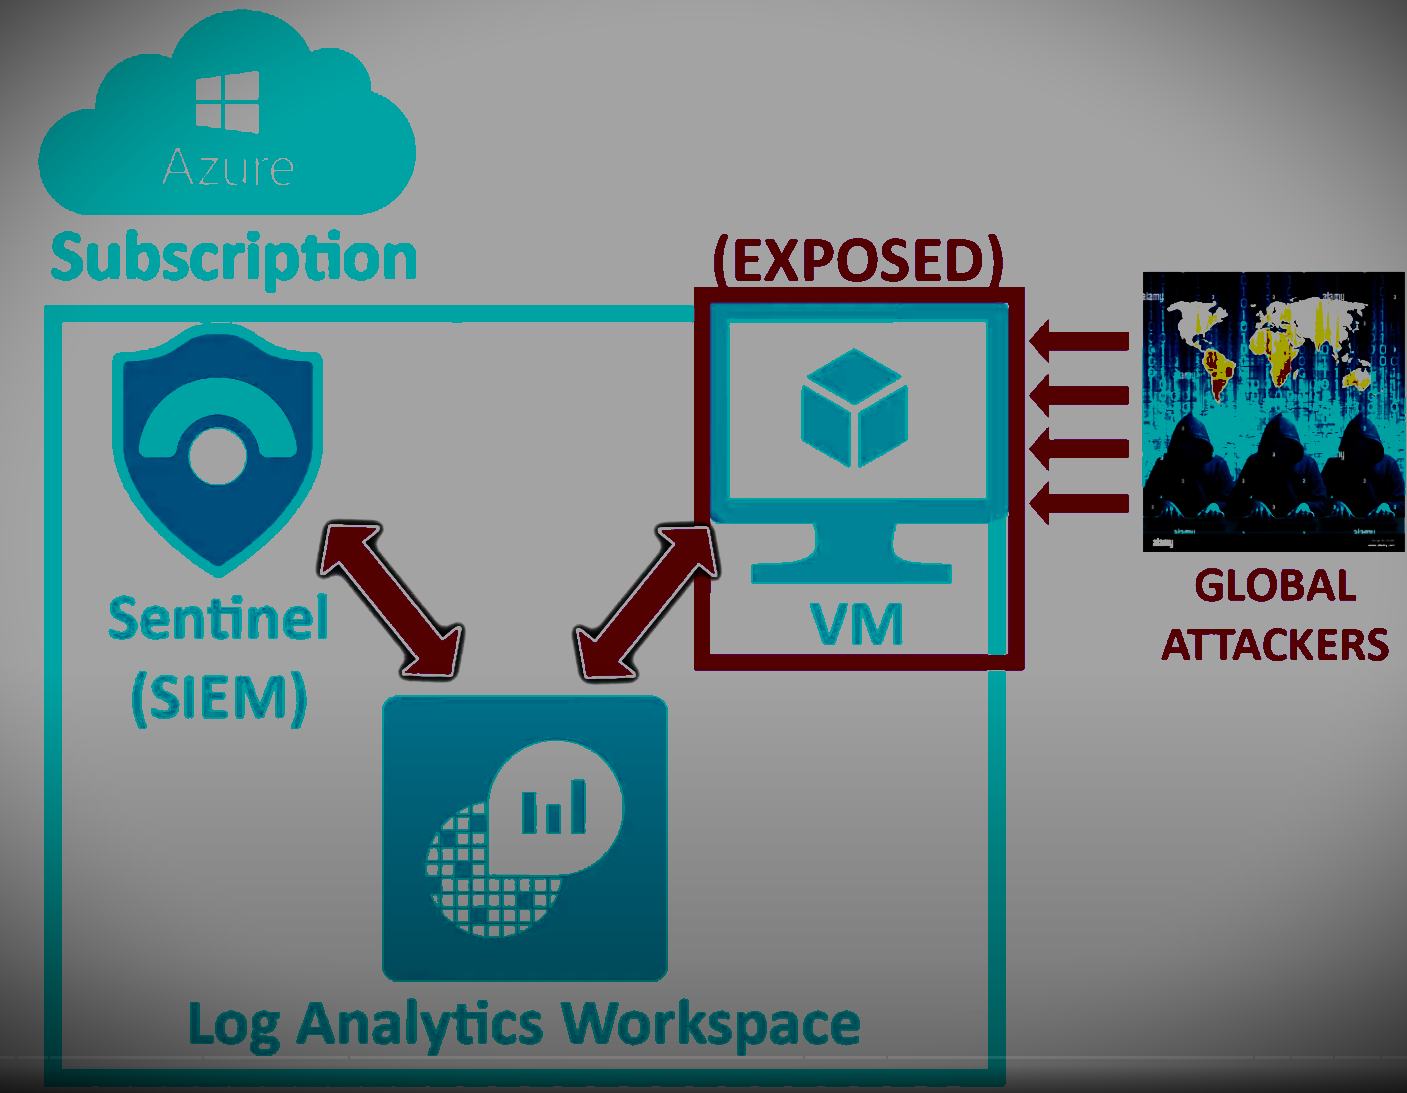
In this project, I utilized Azure Sentinel, a cloud-native security information and event management (SIEM) service, to create a live cyber attack heat map. The objective was to leverage Azure services to monitor and visualize global cyber attacks in real time. By setting up a honeypot environment on Azure and analyzing log data with Azure Sentinel, I aimed to track attacker data and visualize their geographic locations on a map.Methodology
Setting up Honeypot Environment
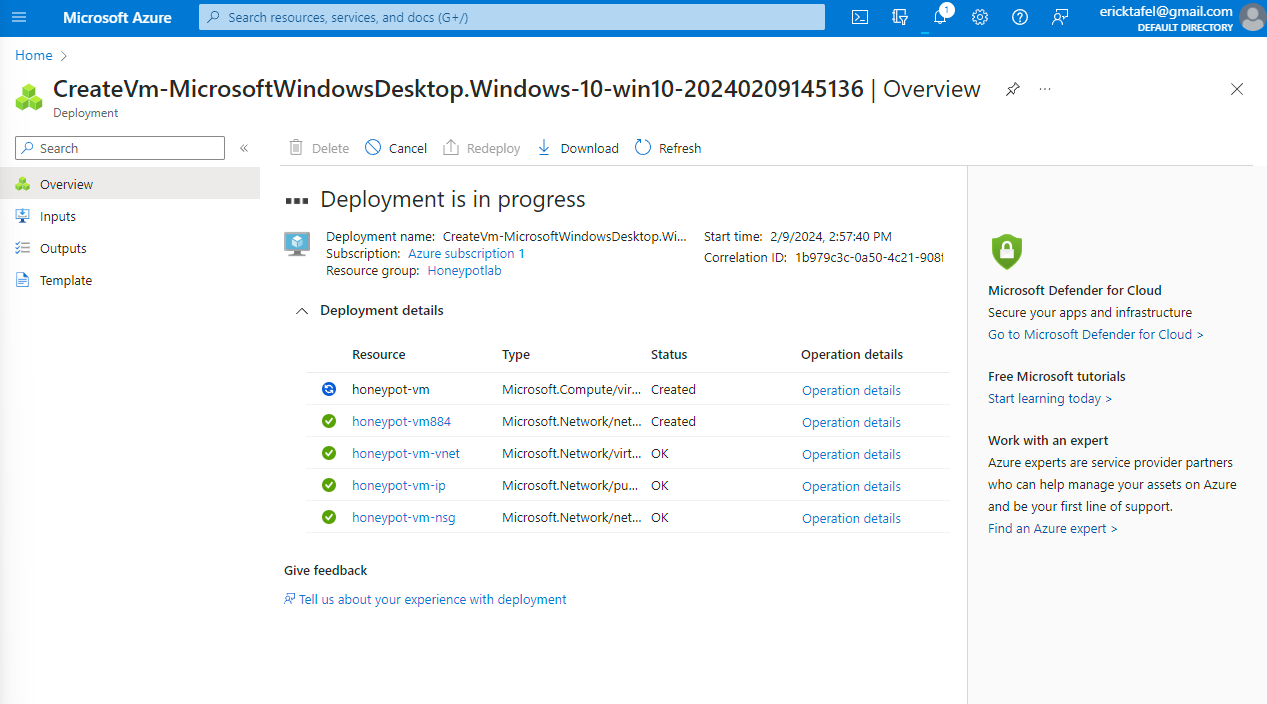
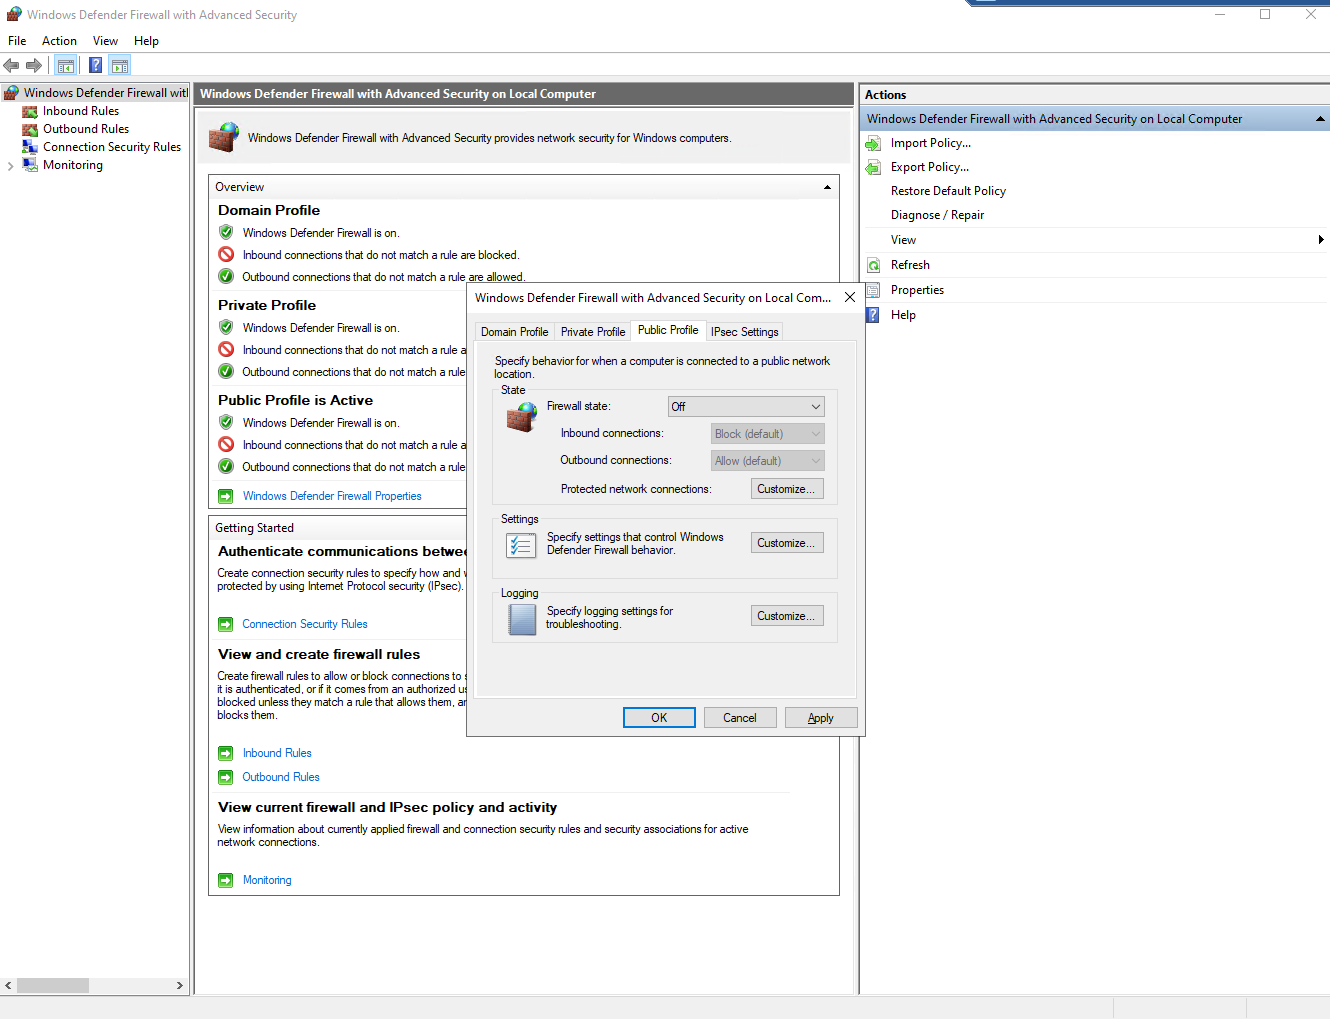
1. Utilized an Azure Subscription to create a Virtual Machine environment acting as a honeypot.
2. Configured the environment to attract global attackers and capture their activities.
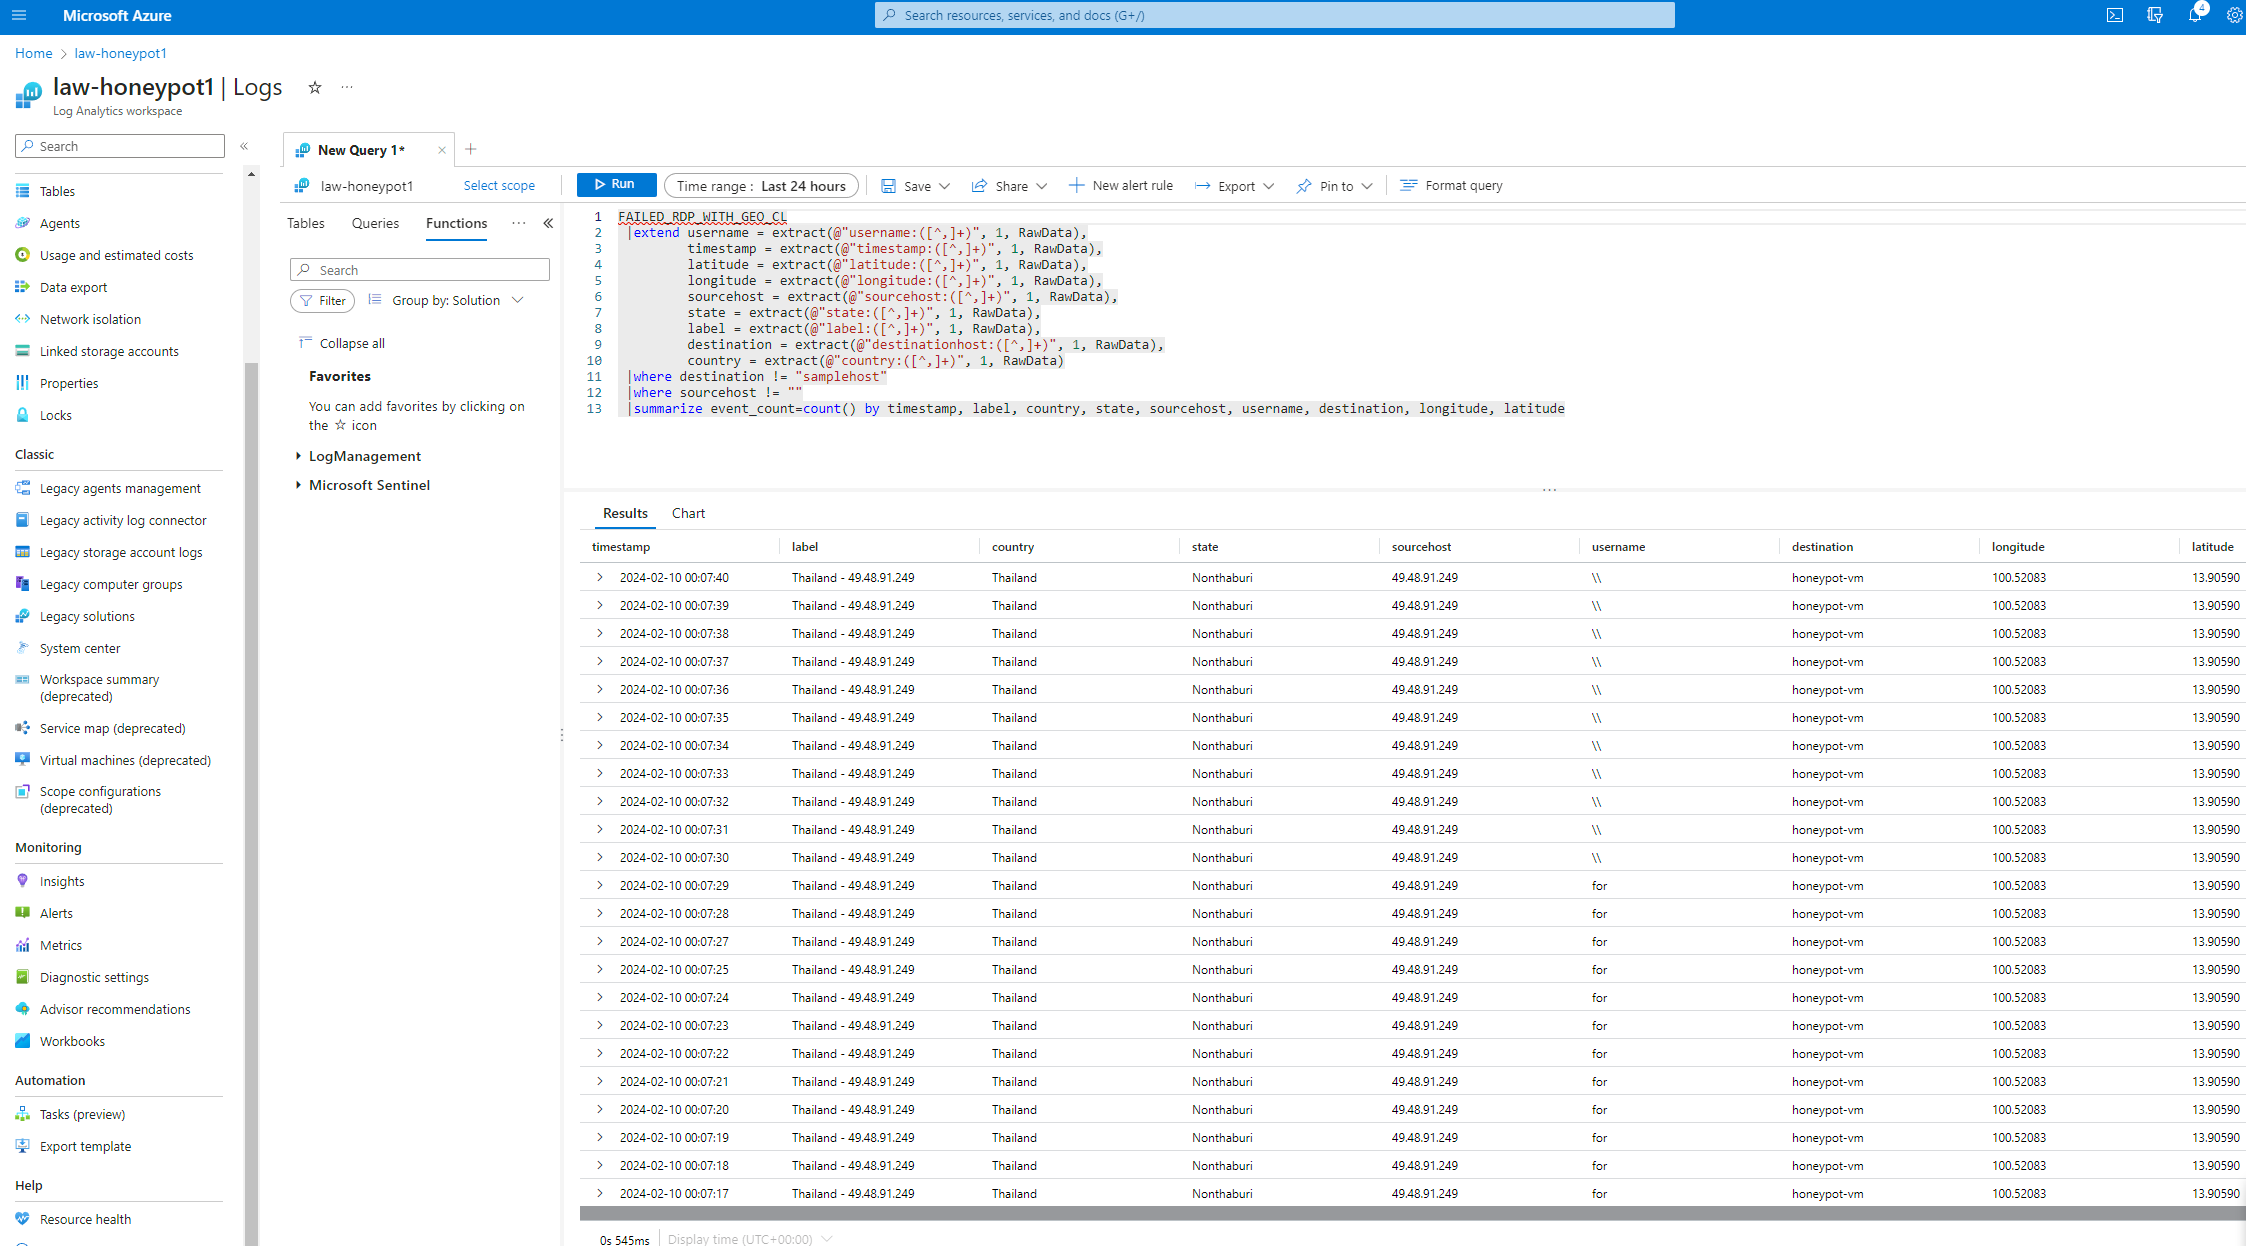
Log Analysis and Visualization
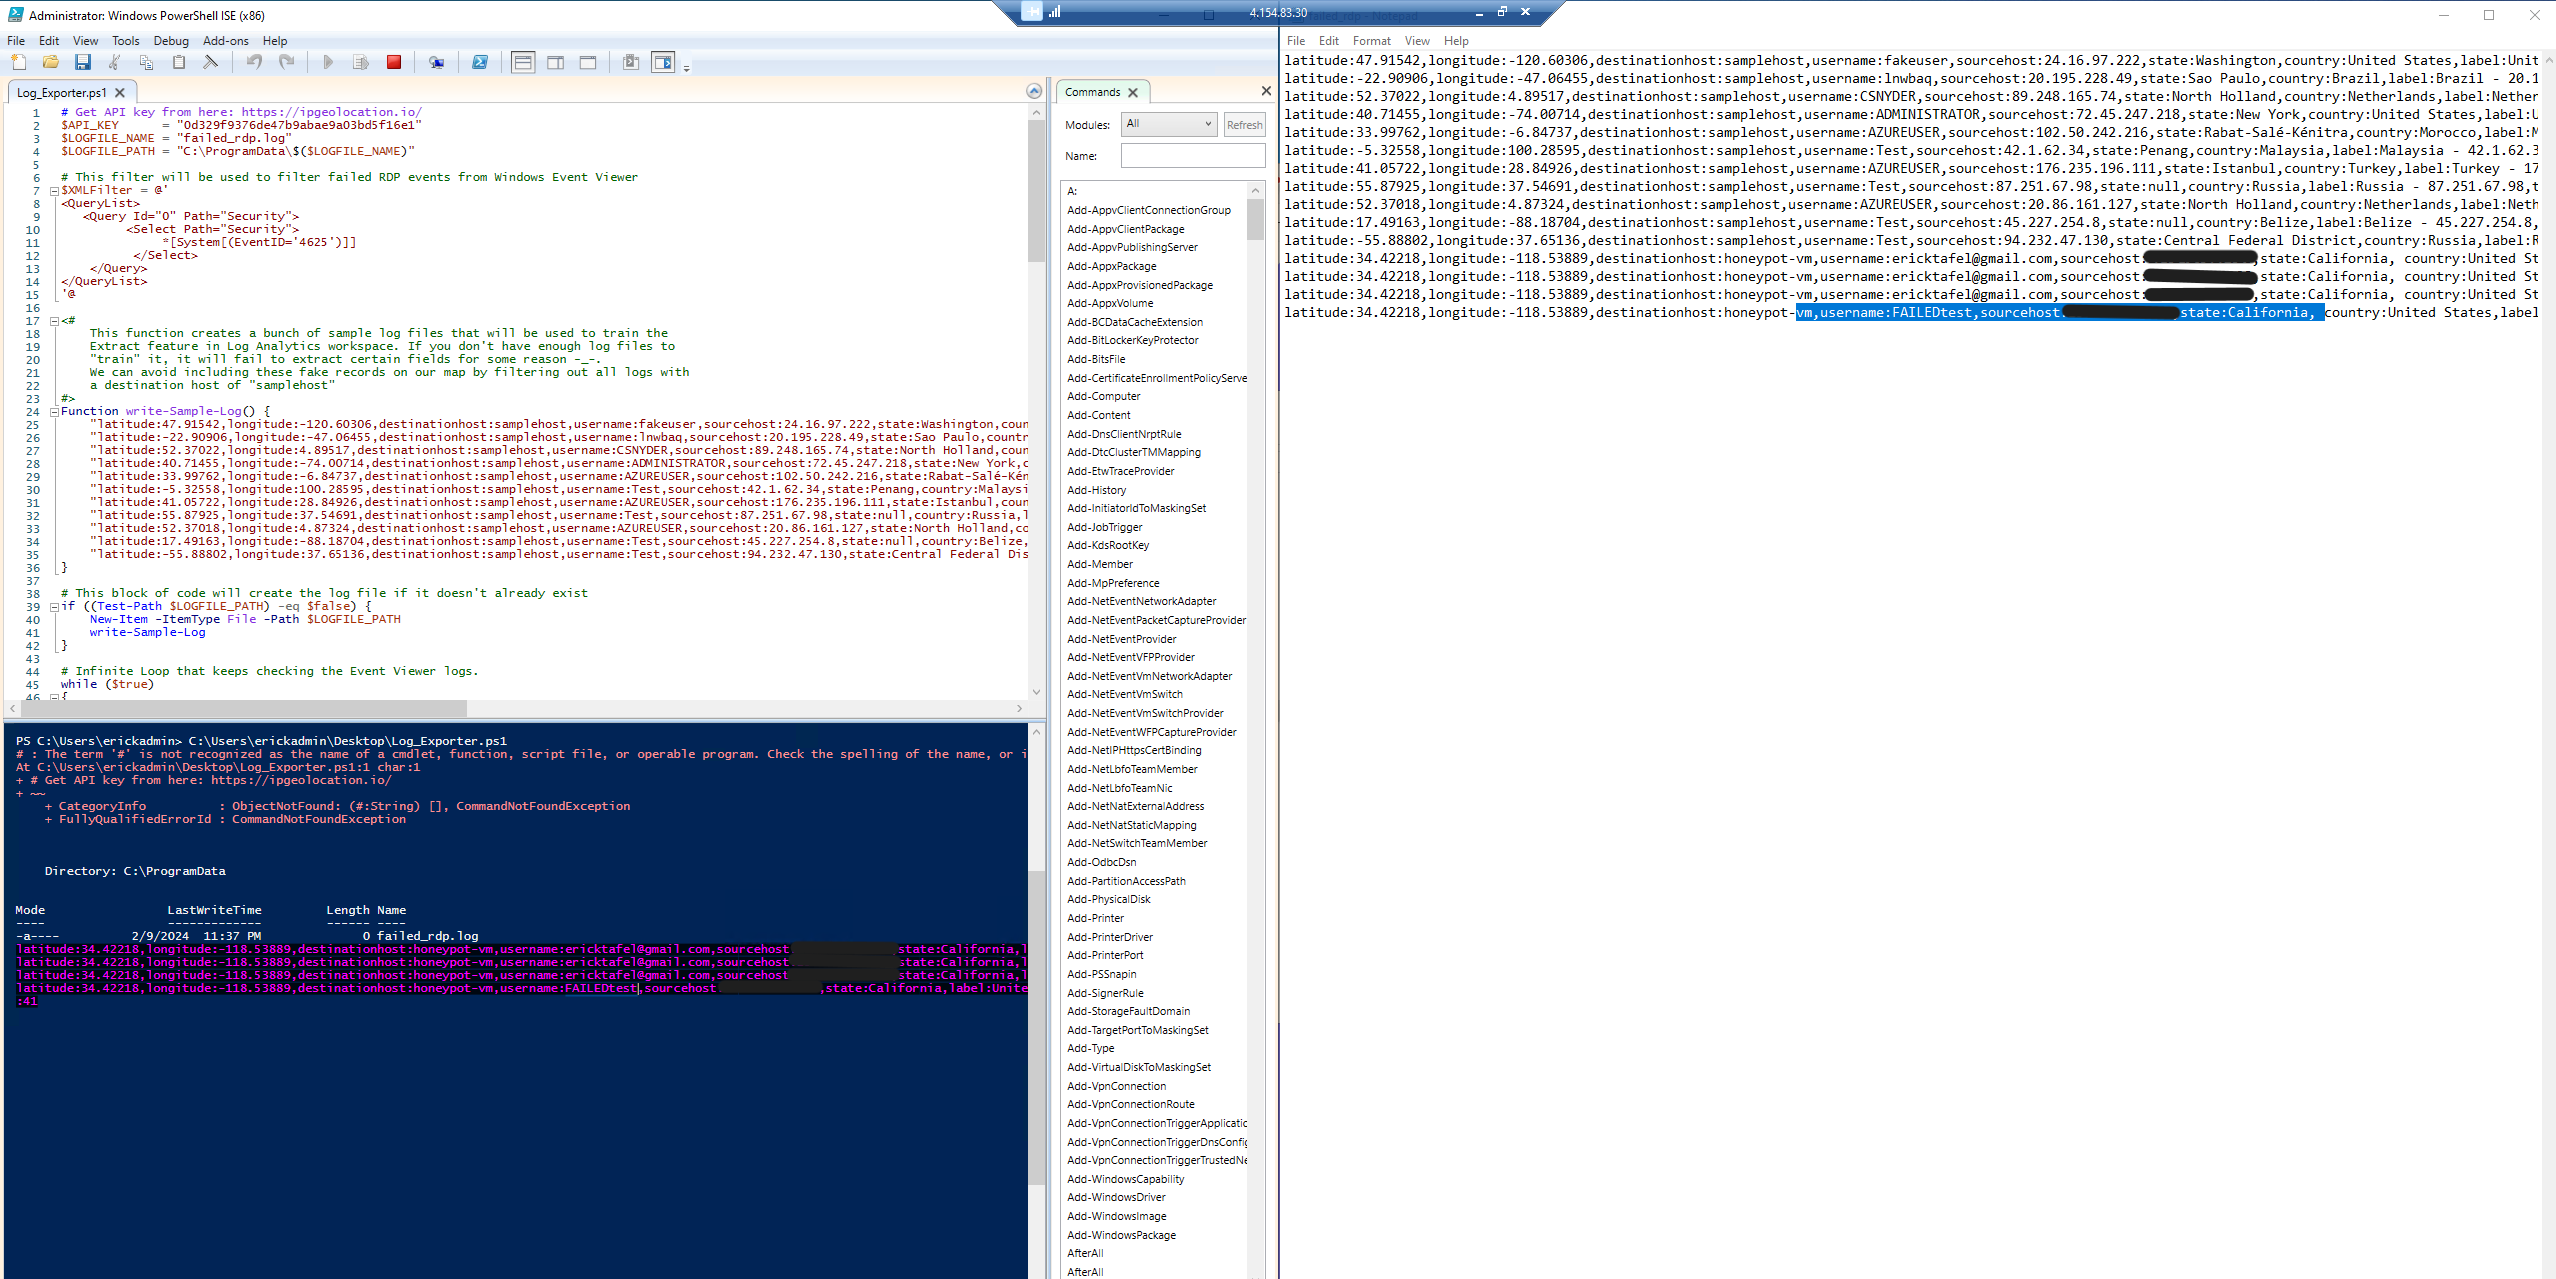
1. Ingested log data from the honeypot environment into a Log Analytics Workspace. 2. Utilized Azure Sentinel to analyze the logs and extract relevant information about attacker IP addresses. 3. Developed a PowerShell script to extract IP addresses from Windows logs. 4. Sent the extracted IP addresses to a 3rd party API to obtain geographic data. 5. Visualized the geographic data on a heat map using Azure Sentinel.
One thing to note is that during the project, I hit the daily API request limit of 1,000 requests provided by ipgeolocation.io. As a result, the IP address from Iran couldn't be converted to geographic data.
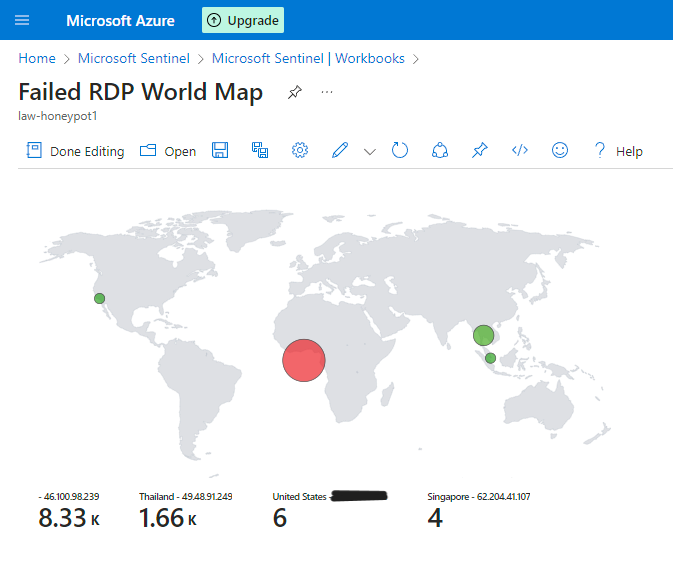
Results
- Iran: 8,300 attacks were traced to the following location:
- Country: Iran
- State/Province: Sistan and Baluchestan Province
- City: Zahedan
- Latitude: 29.48352
- Longitude: 60.86202
- ISP: Telecommunication Company of Sistan O Baluchestan
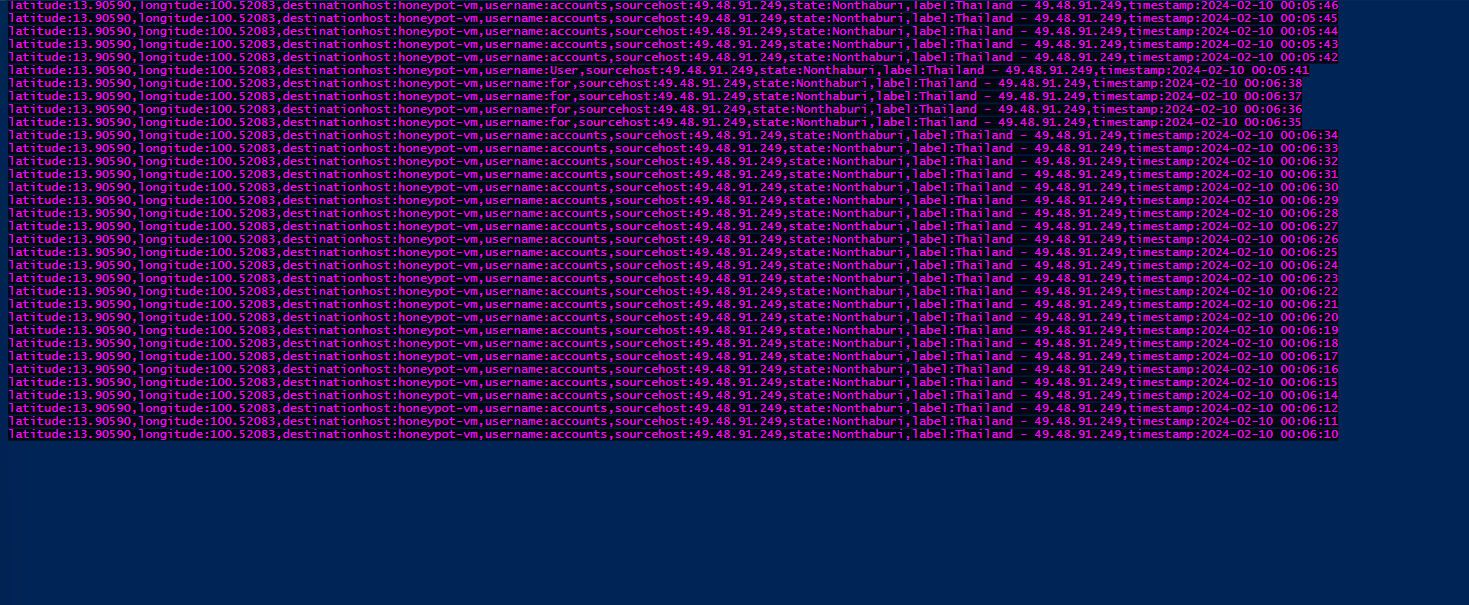
- Thailand: 1,660 attacks were traced to the following location:
- Country: Thailand
- State/Province: Nonthaburi
- City: Pak Kret
- Latitude: 13.90590
- Longitude: 100.52083
- ISP: Triple T Broadband Public Company Limited
- Singapore (later identified as Russia): Initially, 4 attacks were attributed to Singapore, but upon rechecking, the IP addresses were actually from Russia, with the following details:
- Country: Russia
- State/Province: Central Federal District
- City: Moscow
- Latitude: 55.73535
- Longitude: 37.59170
- ISP: HORIZON LLC
Conclusion
Through this project, a live cyber attack heat map was successfully created using Azure Sentinel. Insight into global cyber threats was obtained by leveraging Azure services and analyzing log data. Visualizing attacker locations provides valuable information for enhancing cybersecurity strategies and mitigating potential risks. Note: once finished with the lab, be sure to delete the resources to avoid additional charges beyond the free $200.Credits
YouTube Tutorial by Josh Madakor Although this tutorial is 2 years old, using it combined with the Azure documents page and supportive community in the comments, I was able to adapt to certain steps. Custom Security Log Exporter PowerShell Script. Microsoft Azure Free Tier: Azure cloud services used for project implementation. IP Geolocation API: Third-party API utilized for obtaining geographic data from IP addresses.